How to Discover Where To Start Optimising
When taking on a new client, one of the biggest challenges is where to start first. In this blog post, we’ll describe the methodology we use to discover a web sites week points
Tools
The principles that we describe here can be used across a variety of analytics platforms and tools to analyse the data.
In this blog post, we’ll refer to Google Analytics dimensions and metrics.
We use Analytics Edge to carry out this work. It’s an Excel plugin that allows us to pull down data from the Google Analytics API and directly into Excel.
This means that we can get 100,000 rows into Excel within 30 seconds.
By way of comparison, the Google Analytics interface only allows you to export 5,000 records at a time. You’d need to do 20 manual exports and stich then together to get the same result which would take at least 30 minutes.
Analytics Edge does everything through a set of task driven macros you create within the user interface.
While there are plenty of great tools and languages such as Python and R, they have a relatively steep learning curve and are not for everyone.
Get the Raw Data
Before starting to work on the data, we’ll pull down the raw data.
The configurations that we use will depend on the industry.
For an ecommerce site, we’d pull down metrics such as users, transactions and revenue.
For a lead generation site that relies on form completion, we’d replace transactions with a goal from Google Analytics
We then make 4 data pulls
- Device and OS
- Countries
- Medium / Source / Campaign
- Landing Pages
We eyeball the data to see how clean the data is and whether we need to do any work on cleaning it up.
Cleaning Up the Data
It’s pretty rare that we find that the data is in perfect shape.
Common issues include
- Tracking query strings from tools such as Facebook and Mailchimp
- ?fbclid=uFCrBkUgEvK
- Upper and lower case medium and sources
- Where someone has used Affiliate, affiliate, and AFFILIATE on the same site
Analytics Edge has a couple of handy tools that make this easy to do
The Group function allows you to create your own channel groupings based on medium, source, campaign and landing pages
The Replace function supports Regular Expressions which makes cleaning up extraneous query strings really easy
Finding The Sweet Spots
Once we’re happy that data is in a good enough state to start working with, we then run a series of Analytics Edge macros over the data.
The following is an explanation of how to analyse visits by device and OS for a a lead generation site.
1. Extract Google Analytics data
We get Analytics Edge to extract
- Device category and operating system dimensions
- User, sessions, bounces, goal completions (for a specific goal)
This give us the raw data to play with,
2. Create Custom Metrics
Once the data is Excel, we can now create a series of custom metrics
- User conversion rate – number of goal completions / number of users
- % of users – number of users / total number of users
- Cumulative users – cumulative total of users
- Difference from overall conversion rate – difference from overall conversion rate
These then allow us to quickly see how many people are coming in from different OS and device categories and how they performed
An Example
The following is an example of the report that we can create.
The data is simulated and doesn’t come from any of our clients (we never share data)
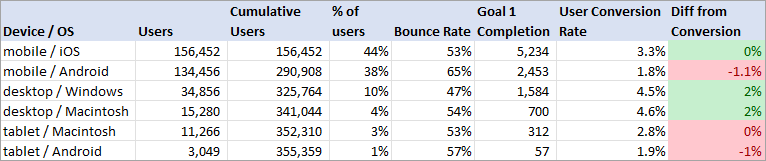
Looking at the report, two things are clear
- Android mobile users account for 38% of all users
- The conversion rate for Android users is 1.1% lower than the overall conversion rate and 1.5% lower than iOS mobile
- The bounce rate for Android mobile users are 12% higher than iOS mobile users
This gives us a pretty good idea that we should be looking at Android mobile users and discovering why the conversion rate is so much lower
You’re Only Limited By Your Imagination
By selecting the dimensions and metrics relevant to your industry, you can create bespoke reports
A couple of examples
- Grouping users and sessions by countries allows you to separate out the top 5 countries that send traffic and place the others into a rest of the world
- Creating custom marketing channels and combining with device categories to really understand the impact of marketing campaigns
- Looking at desktop visits by device resolutions to see whether this has an impact
Find Out More
If you’d like to find out more, please contact using the form, call us on 0207 993 5482 or email info@digitalnation.co.uk