Ten Reasons To Consider Analytics Edge
Anyone who has seen me talk at a conference or a meetup over the last 10 years, will have seen me evangelise about a tool called Analytics Edge.
It originally started as a plugin for the Windows version of Excel. The latest versions integrate with Google Sheets and also run on a Mac.
Analytics Edge has revolutionised how we use data at Digital Nation, and here are the 10 reasons why you should try it.
You can download a 30 trial copy from the Analytics Edge web site
- No Code Solution For Exploring Data
- Load data directly from the GA4 and GSC API
- Use Regular Expressions in Excel
- Create Custom Fields Based On Other Data
- Build once, run multiple times
- Use REST APIs from within Excel
- Repeat Macros – It’s Secret Power
- Export to Excel, Sheets or CSV
- Superb Support
- Hooks into the Google Search Console Inspection API
1) No Code Solution For Exploring Data
There are many excellent web resources on how Python / R / SQL will revolutionise the way you deal with data.
However, only some have the time or the skills to learn these languages.
I’m dyslexic and know from many hours of trying that coding is not a skill that will come naturally to me (with my form of dyslexia)
Rather than writing code, Analytics Edge allows you to create step-by-step macros that allow you to import, transform and export your data.
This is done directly in either Excel or the their app.
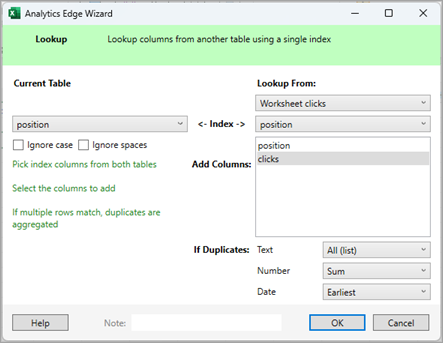
It also means that instead of having to remember complicated Vlookup statements in Excel, I can use the built in Lookup function to do the same thing
2) Load Data Directly From The GA4 And GSC API
Google Search Console web interface limits you to just 1,000 rows per export.
Analytics Edge has a connector that hooks directly into the Google Search Console API and allows you to access more data.
For some of our larger customers, we have extracted the 750,000 queries directly from the API
The same applies to the GA4 API, which has a handy filter facility to extract the data you need.
One of the biggest time savers is that this data comes directly into Excel and doesn’t need be downloaded as CSV and imported in each time
There also other connectors available for Bing Webmaster Tools, Facebook Ads, Google Ads, LinkedIn Ads, Microsoft Ads and MailChimp
3) Use Regular Expressions in Excel
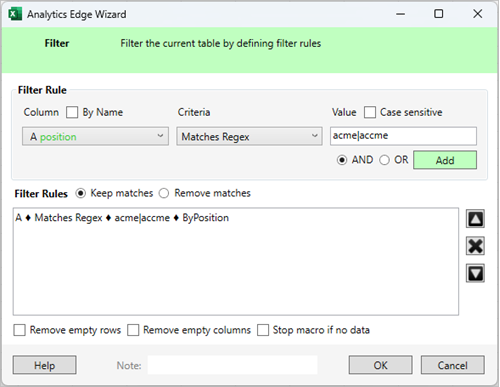
This is one of the most valuable functions, and we use in 3 places
- Filtering the datasets
- Transforming the data using the search & replace
- Creating custom fields
4) Create Custom Fields Based On Other Data
The group function allows you to create a new field to enrich your data sets.
A good example is when we download a clients Google Search Console data we add three new fields
The first is Brand vs Generic, where we’ll use a regex to gather the brand name and all its misspellings to create a value called Brand. Anything else is generic
The second is Site Sections, where we’ll use the URL structure to break the data into groups.
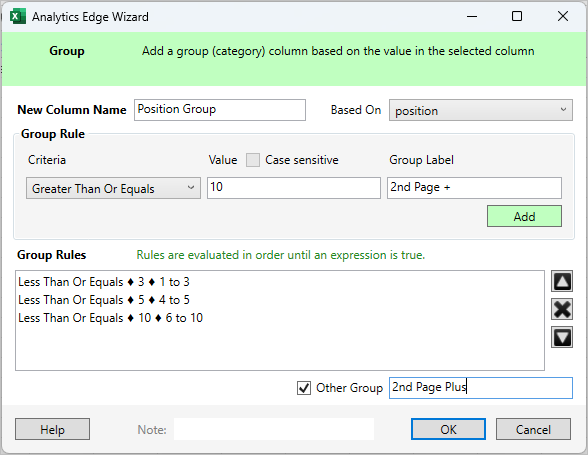
The third and, illustrated below is one called Position Group which groups the average position into four bands.
We tell Analytics Edge to look at the position field and, in this case, look at the value to see what rules should be applied.
5) Build once, run multiple times
Once you’ve created a macro, it can be used time and again, which is ideal for tasks that need to be done regularly.
For an ecommerce client, we have a macro that we run once a week to help them understand where to optimise the site.
- Imports a CSV file of 15,000 skus with category, sub category, gender and brand fields
- Creates a list of the most popular category,gender and brand combinations
- Takes the top 10 womens and mens brand and category combinations and lists the top 10 subcategories
- Updates 2 graphs showing number of skus by groups
- Upload to Google Sheets
While the macro may have taken an hour to write, it takes 20 seconds to run the report each time.
6) Use REST API’s from within Excel
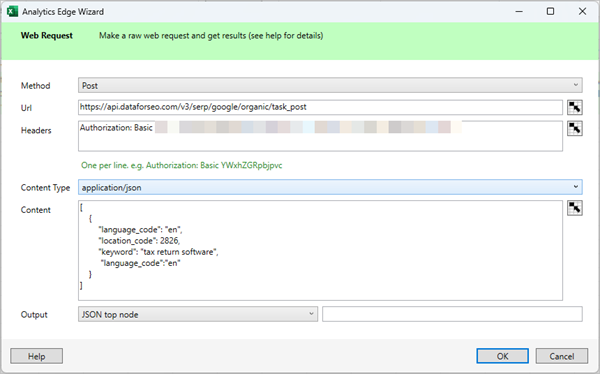
A recent addition has been the ability to query web-based REST API
Usually this needs to be done via Node, Python or PHP which requires some development resources.
The ability to do this from within Excel makes the data immediately available
Over the last couple of weeks we’ve successfully pulled data down from tools such as DataforSEO, OpenAI, TextRazor and WebPageTest
It’s even more powerful when used in conjunction with the Repeat Macro facility.
7) Repeat Macros – It’s Secret Power
This function allows you to run the macro multiple times each time with a different value.
A good example is where I need to download a 13 months Google Search Console data and split it by months to see where traffic has been tailing off.
The Google Search Console API provides daily data, but not monthly.
To do it via the Google Search Console web interface would mean
- Changing the date options 12 times
- Exporting 12 CSV files
- Stitching together 12 files
Also, I still only get 1,000 rows per export
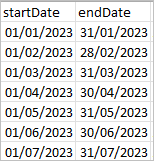
Using a repeat macro, I can specify 13 month periods with a start and end date and Analytics Edge will repeat the macro 14 times with different date values
In addition, I’ll get all the data available to the API
Another thing that it is very useful for is importing multiple CSV files
Inside the repeat macro, I specify the file locations, and Analytics Edge loads each one in turn and applies the transformations I want
8) Export to Excel, Sheets or CSV
The majority of the time, our final data stays in Excel
However, for some clients, we’ll export to Google Sheets or export a CSV file.
9) Superb Support
I’ve been involved in technology for over 30 years and the support that we have received from Mike Sullivan over the last 10 years has been outstanding.
I just wish every software company was as good as this
10) Hooks into the Google Search Console Inspection API
Rather than to check each URL via Google Search Console web interface, you can send up to 2,000 URLs per day (per property) to get all data Google Search Console holds on each URL
You can then
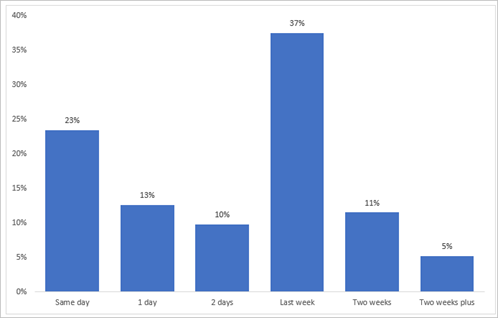
- Quickly summarise the number of URLs indexed or not
- See which are the referring pages
- When the page was last crawled
We use the regex to tidy up the dates and the group to create easy to understand bands to create graphs such as this
Want to know more?
If you’d like to know more about how we can help you to use Analytics Edge to revolutionise the way you use data, please get email Charles Meaden to find out more

